

Tracing a network mystery across HRT’s global compute cluster
As our compute spreads around the world, we’re constantly shipping data from site to site. We built a system that joins service telemetry with eBPF tracing and network hardware byte counters to show us which users and programs are generating the most traffic.
Intro
HRT’s trading is backed by an enormous amount of research computation. We train a diverse set of models on years of history from exchanges around the world, and then we simulate their behavior in countless trading scenarios. From a systems perspective, this means many CPUs and GPUs processing data from many drives, with widely varying access patterns and plenty of network communication between machines.
Long ago, most of this work happened within a single site. Then we spent years expanding our storage and compute globally, including to distant places like Norway. Accordingly, programs increasingly ran far away from the data they needed, and WAN bandwidth became an important constraint. When inter-site traffic inevitably overwhelmed the network, we discovered we had weak observability: it was too difficult to determine which users and workflows were responsible.
A Slow Day
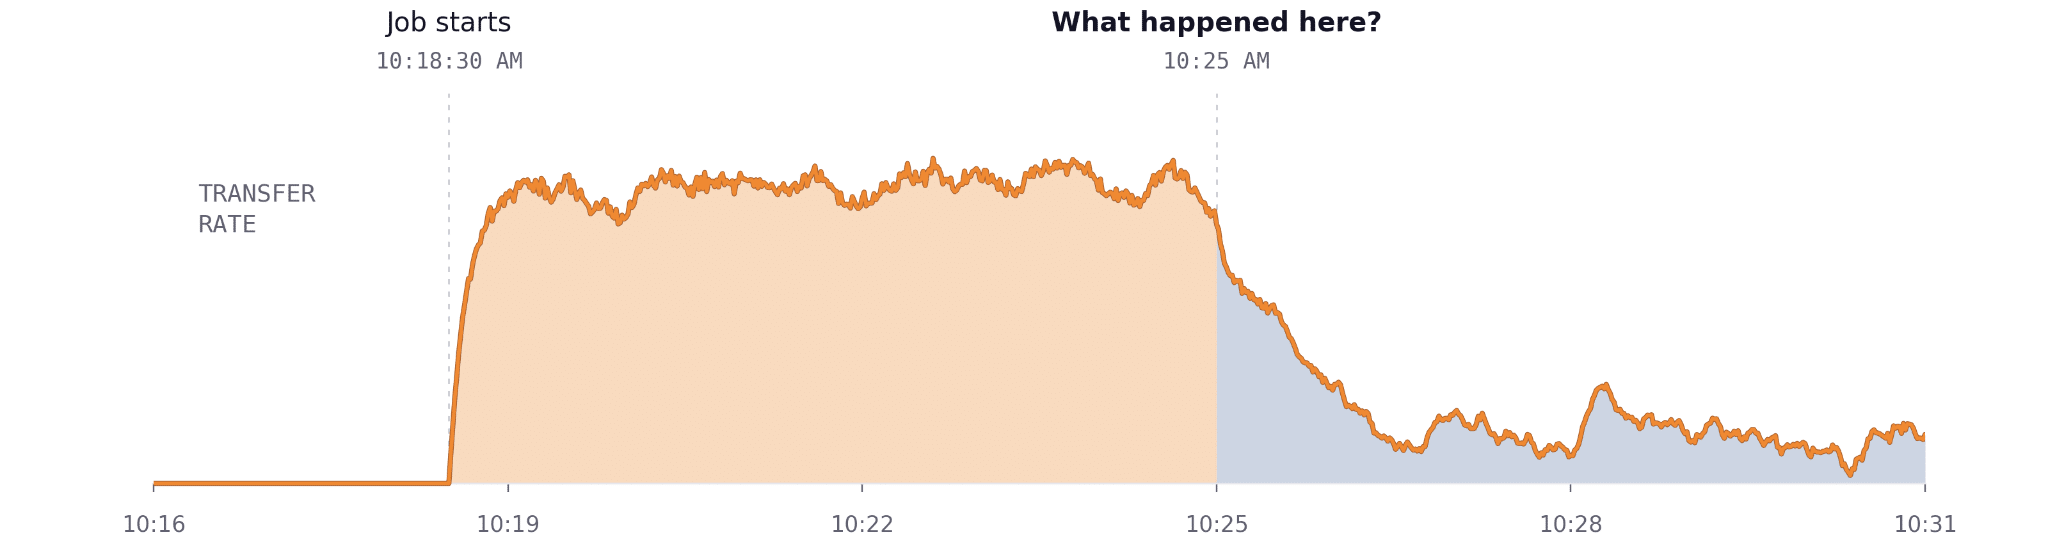
One incident surfaced when a model training run took too long. This program used GPUs in Chicago to analyze data from New York. Our cross-region data transfers go through a dedicated service called DupeDog, and that’s how our program mirrored the data to Chicago for training. This step stalled, so we checked our dashboard, which clearly showed our transfer rate had cratered. The data shown is stylized (both simplified and exaggerated) from a real incident.
Shared Capacity
This isn’t our model’s very own personal cluster. At any instant, DupeDog is “duping” lots of data for users all over the company. So, it’s sort of obvious what’s wrong here! Clearly some other people started doing transfers, and we had to share the capacity. Let’s just add everyone else to the plot and we’ll have our answer.
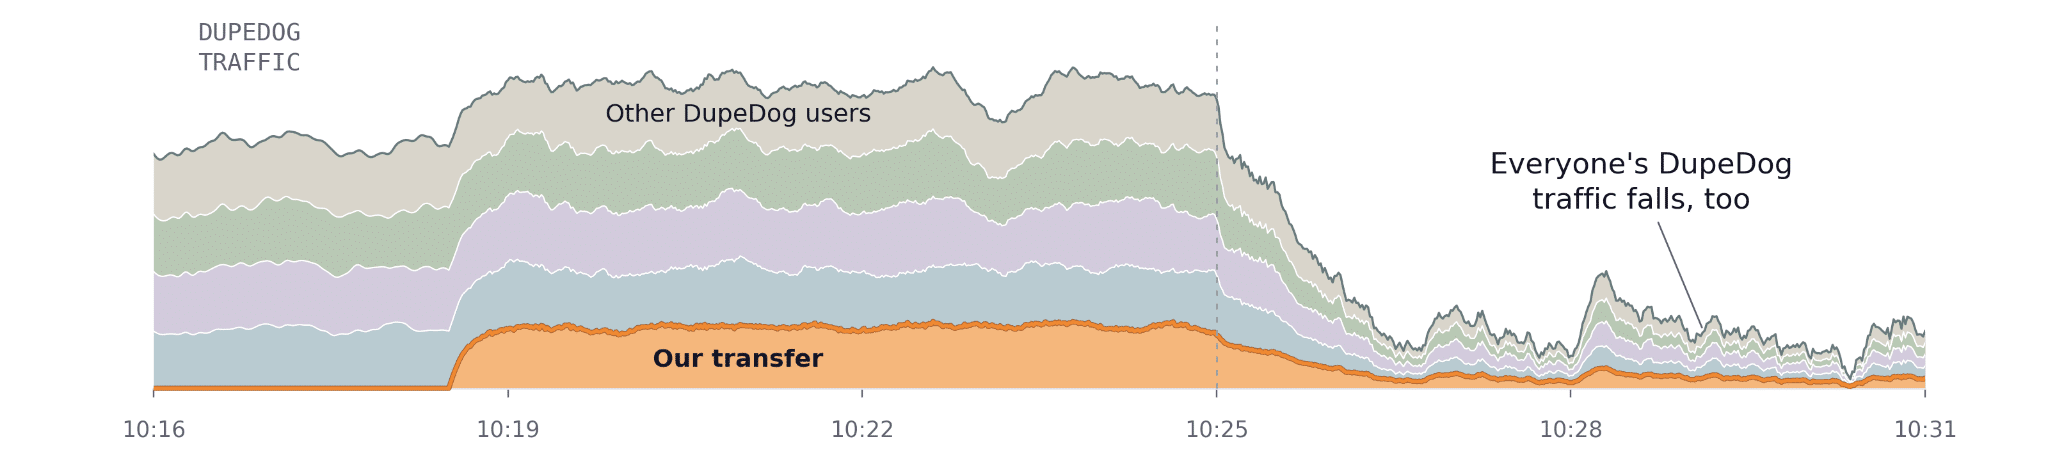
We indeed see other DupeDog users sharing bandwidth, but nothing new showed up at 10:25. Everyone’s transfers just suddenly slowed. The DupeDog logs won’t give us the answer. Let’s look at the raw network switch counters to see how many bytes were flowing into the site, irrespective of how.
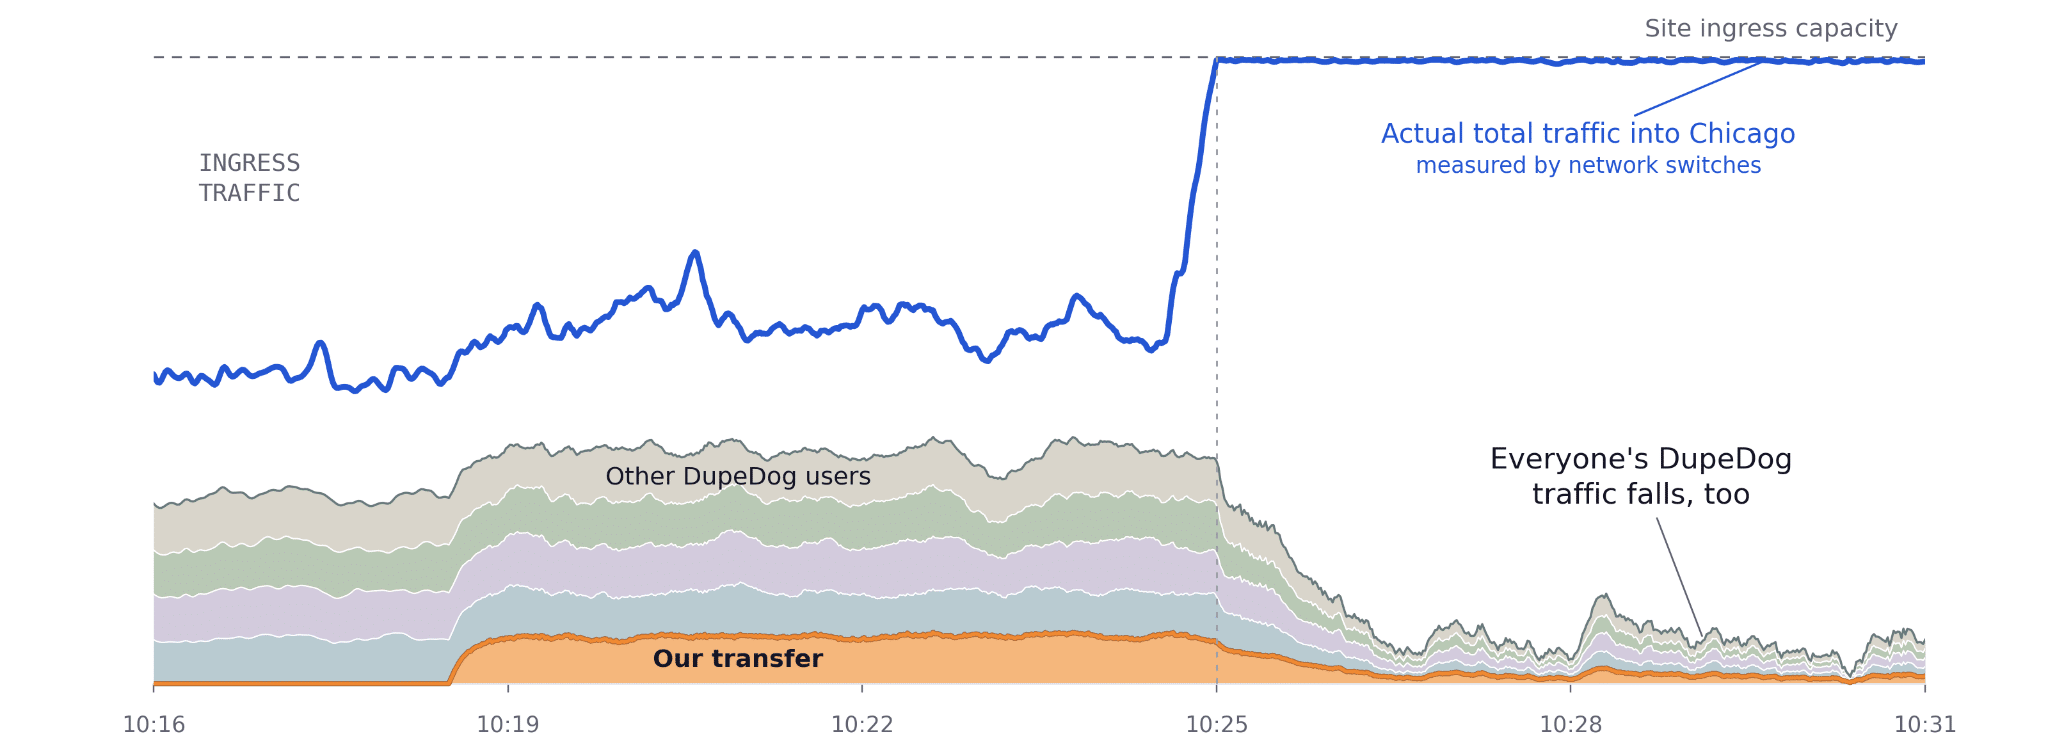
The blue line shows some unknown source of traffic completely saturating the network capacity into Chicago. Whatever’s doing this, it isn’t DupeDog.
More Than One Way In
DupeDog may be the “standard” way to move files between sites with fair allocation, but we still shouldn’t be surprised that it doesn’t cover everything. We give researchers a lot of freedom to choose their tools and build their own workflows so they can iterate quickly on ideas. As nice as it’d be to have 100% of WAN traffic pass through a single service, we haven’t found it pragmatic given the diversity of reasons why data might move. Accordingly, we have multiple services sharing the network. One major example is our distributed file cache, Cashy, which sometimes uses the WAN to fetch data from another site’s cache.
Let’s add the other services to the graph. For simplicity, we’ll show only DupeDog and Cashy.
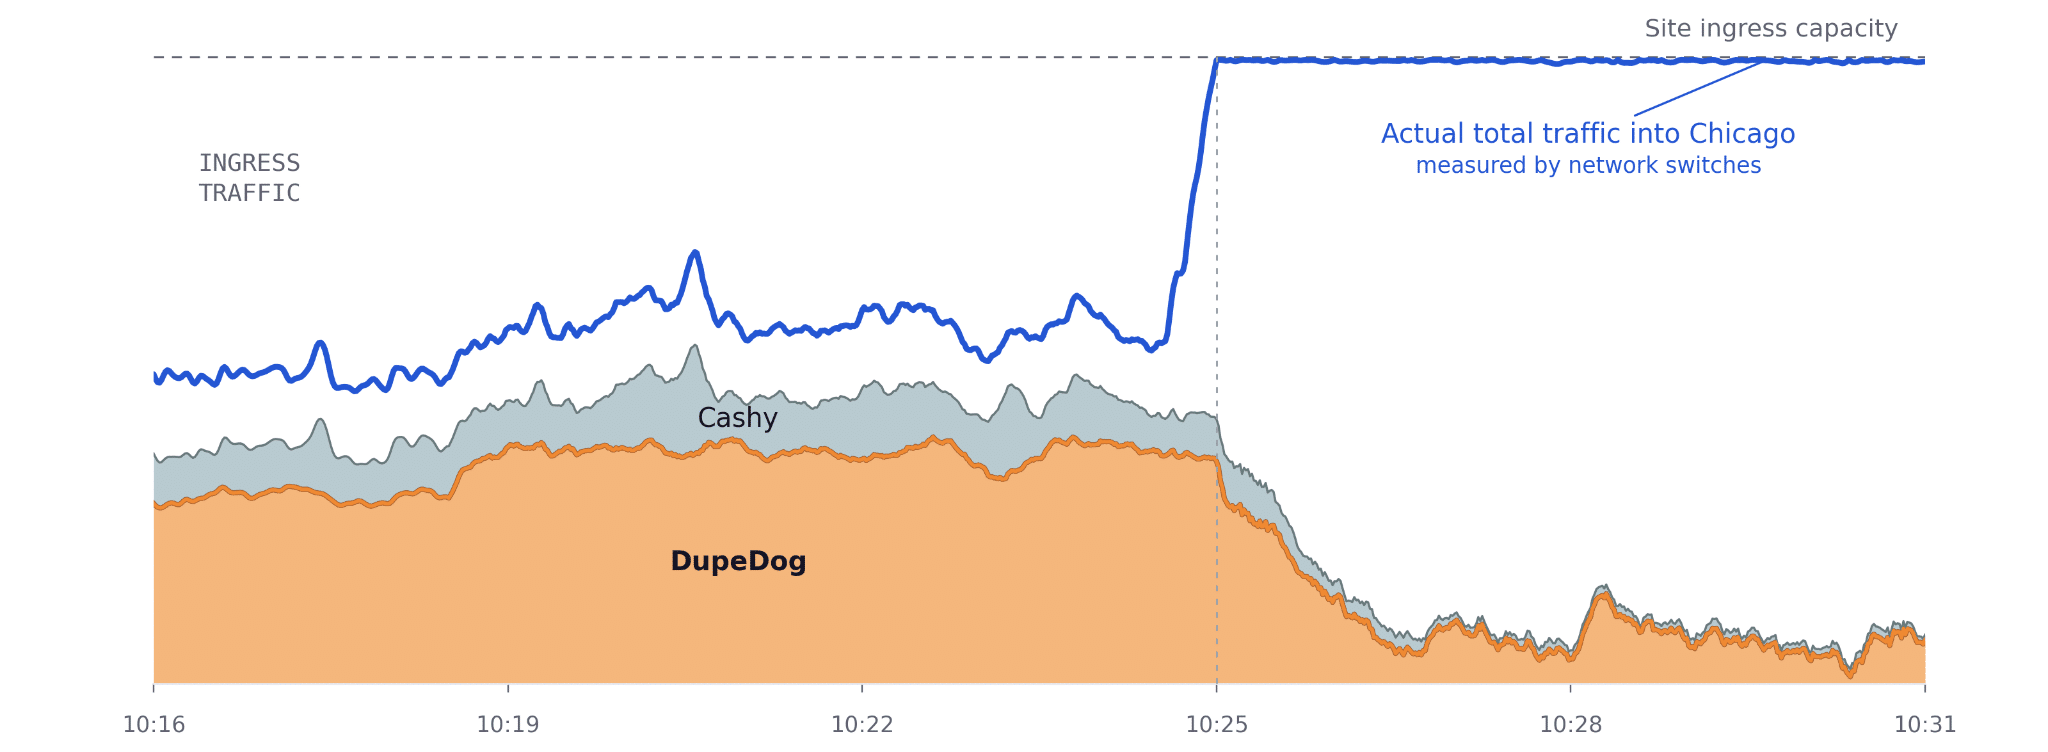
Well, it isn’t Cashy either. Now we have a problem.
Services like DupeDog and Cashy have a nice property where we can log requests with rich information about users and workflows. But this method only covers traffic through those services, and our machines can talk in plenty of other ways. This means we could be dealing with any number of explanations, including socket communication between jobs, storage cross-mounts, somebody scp-ing something, a new service we forgot to log, a user’s custom webserver, who knows?
With more arbitrary network traffic, how can we connect users and programs to their WAN usage?
Comprehensive Capture with eBPF
A service like DupeDog will have an RPC method very roughly stylized as:
void dupe(data=myData, to=there, ...) {
    // First write down exactly what we were asked to do.
    log(user=..., program=...,
        from=here, to=there,
        data=myData, bytes=myData.size(), ...
    );

    // Then actually copy the data.
    int sock = socket(AF_INET, SOCK_STREAM, 0);
    connect(sock, ...);
    send(sock, ...);
    ...
}
The key point is that we get a logged event whenever the service does anything. But what can we do when one of our users directly writes their own networking code? Their custom socket code skips our logging, but still passes through the Linux kernel’s networking stack. We need a way to hook directly into kernel networking functions to detect their usage.
Fortunately, eBPF provides that mechanism.
Sooner or Later, tcp_recvmsg (Mostly)
Users code in multiple languages, and they use many different libraries and functions to communicate over the network. If receiving data via TCP, they could indirectly invoke a Linux syscall like read, readv, recvfrom, or recvmsg. After some socket and protocol dispatch code inside the kernel, code paths generally find their way into a function named tcp_recvmsg.
eBPF lets us attach small hook programs to the entry or exit of most kernel functions. These hooks run inside the kernel, with minimal overhead. In short, something like this:
SEC("fexit/tcp_recvmsg")
int BPF_PROG(
    fexit__tcp_recvmsg, struct sock *sk, struct msghdr *msg,
    size_t len, int flags, int *addr_len, int ret) {
  if (ret > 0) {
    __u32 pid = bpf_get_current_pid_tgid() >> 32;
    // this example assumes IPv4
    __be32 remote_ip = sk->__sk_common.skc_daddr;
    bpf_printk(
        "Hello from tcp_recvmsg! PID %u read %d bytes from %pI4",
        pid, ret, &remote_ip);
  }
  return 0;
}
The above would print a message in the kernel tracing buffer every time tcp_recvmsg returned a positive byte count. Crucially, we also get the PID, so we can attribute the traffic to a user!
Don’t Panic! The Kernel Won’t
As useful as it sounds to run arbitrary code inside the Linux kernel, shouldn’t we worry about bugs? An off-by-one error in user code might segfault one process, but a similar problem inside the kernel could bring down the entire system. At first glance, using eBPF could reasonably be regarded as a bad move.
Fortunately, eBPF is smarter than this. When asked to load a new program, it uses a verifier to statically prove safety properties about the program. This means checked memory accesses, initialized registers, no unbounded loops or recursion, valid pointer use, etc. It’s quite strict, and it is sometimes challenging to reorganize a program until the verifier can establish those properties.
Every Byte Counts
What should we actually do in our callback? One option is to build an event from every call, move it to userspace, and then ship it to our analytics platform (backed by Iceberg tables and ClickHouse). But do we really need to store so much data?
Our main use case is to see the primary drivers of network utilization. This means we only need to count per-minute byte totals, grouped to aid attribution to users and workflows. eBPF has a feature called “BPF Maps” providing data structures that live in kernel space. In the kernel, we can do something conceptually similar to this pseudocode, on every successful tcp_recvmsg :
key = (pid, local_ip, local_port, remote_ip, remote_port)
bytes_received[key] += received
We keep separate counters for each CPU so that we don’t have to worry about contention. At the end of every minute, we pull these counts into userspace, sum them across CPUs, and combine them with metadata collected about each process. This lets us attribute the traffic to users, programs, and workflows (larger runs spanning many jobs). Finally, we ship these byte counts to our analytics platform.
A fair bit of extra code is omitted here, particularly dealing with race conditions and health reporting. Further, even per-minute totals can generate an excessive amount of telemetry, so we downsample those records with an interesting Priority Sampling Algorithm. But this is the overall approach.
Wait, Who’s This “root” Person?
After installing eBPF hooks across our cluster, we’ve gained the ability to see which user accounts sent and received how many bytes, from where to where, via which programs and workflows. This sounds promising, but we are very much not done yet.
Let’s look at our new eBPF telemetry. We added this code after the initial incident, but we’ll synthesize it atop the original example to make things easier to follow.
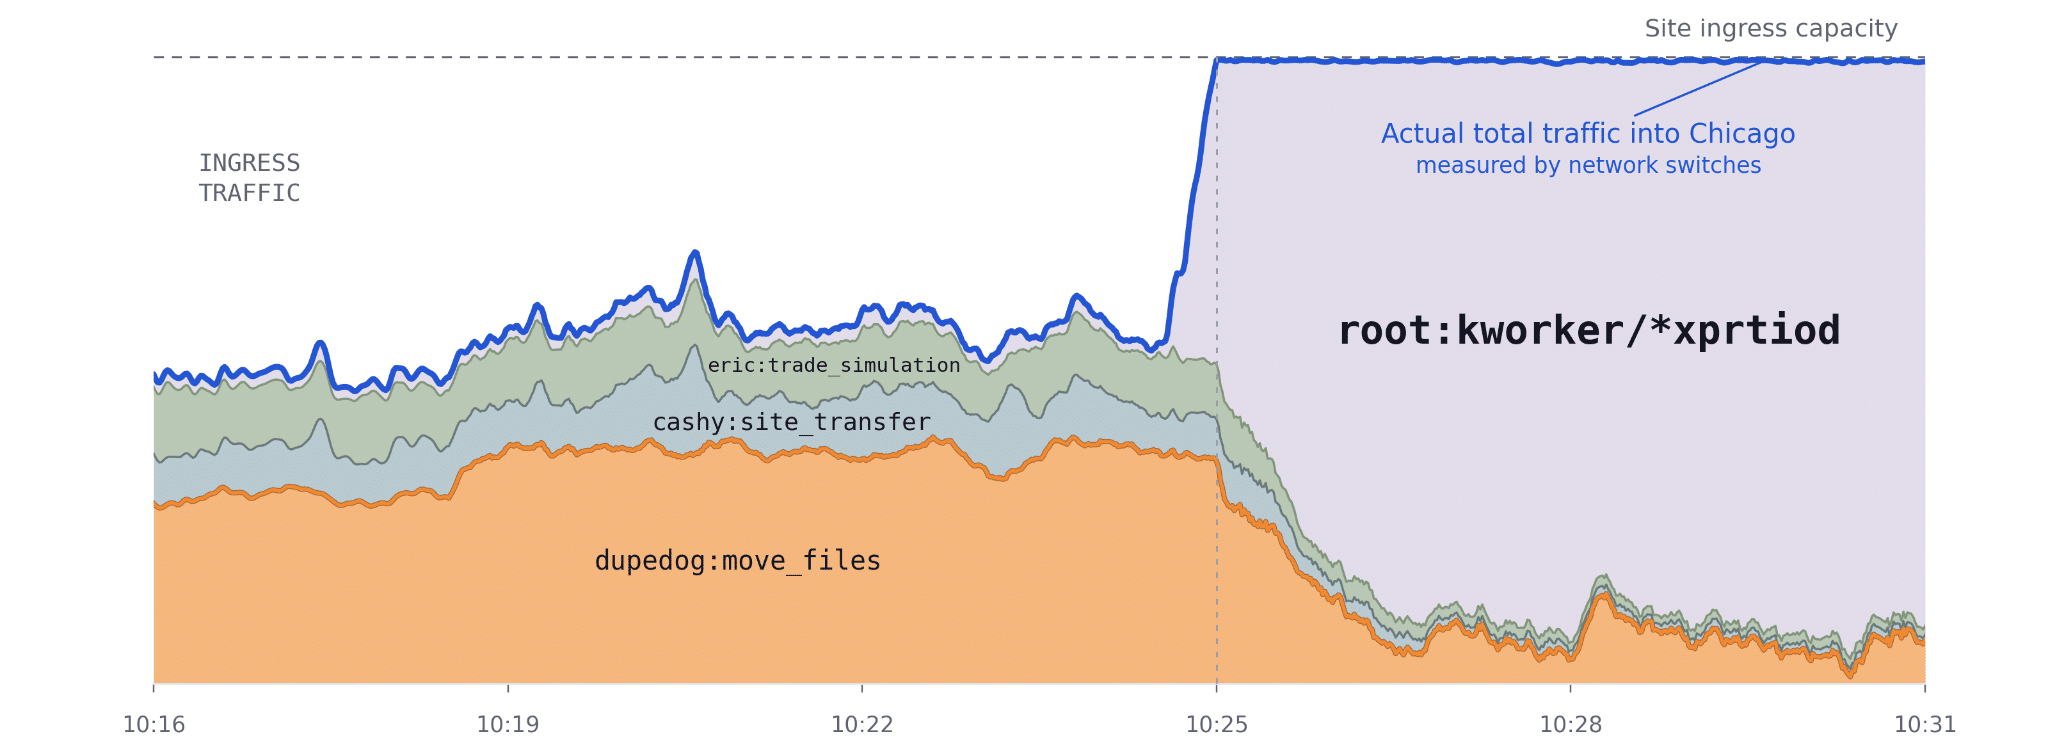
… Hooray?
The good news is that eBPF has managed to capture the missing traffic. Most of the newly visible activity prior to the incident was from the eric:trade_simulation workflow. This is a great new piece of visibility because this program uses TCP sockets directly, and yet we still see its network traffic.
There are, however, two serious problems with our eBPF-based usage graph:
- The traffic responsible for the saturation comes from the
rootuser, via a mysteriouskworker/*xprtiodprogram (name abbreviated). - Though eBPF has correctly observed the network activity of the DupeDog and Cashy services, their traffic is attributed to the
dupedogandcashyaccounts, running programs likemove_filesandsite_transfer. Unfortunately, it doesn’t show us who requested those transfers.
We’ll solve these two problems in different ways.
It’s Always NFS
We should have predicted this. xprtiod is a kernel workqueue used by the NFS client for network I/O. NFS, the Network File System, lets a program access files on another machine through ordinary filesystem operations. Reading a file can therefore trigger a network transfer.
The kernel’s NFS client shares cached data and server connections across processes, with kernel workers receiving data on their behalf. As a result, even when a user process initiates the read, our tcp_recvmsg eBPF hook can execute in a kernel worker. The NFS client has therefore defeated our eBPF monitoring, which “correctly” reports that root is receiving the data, without telling us what user requested it.
Let’s not give up so easily. We can’t get comprehensive user attribution with tcp_recvmsg alone, but NFS reads go through the kernel too. Tracing NFS-based network activity back to user processes is tricky, but not impossible. Our first attempt hooked vfs_read, the kernel function invoked when a process calls read(). The problem is that filesystems implement caching, so a repeated read can avoid a network transfer the second time. Ignoring this effect would overestimate the true network traffic.
We eventually had to trace the low-level NFS functions that actually fetch data, including those triggered through memory mapping or asynchronous I/O. We recorded which process initiated a request, then matched that information to the resulting data transfers. This was admittedly painful, but we made it work!
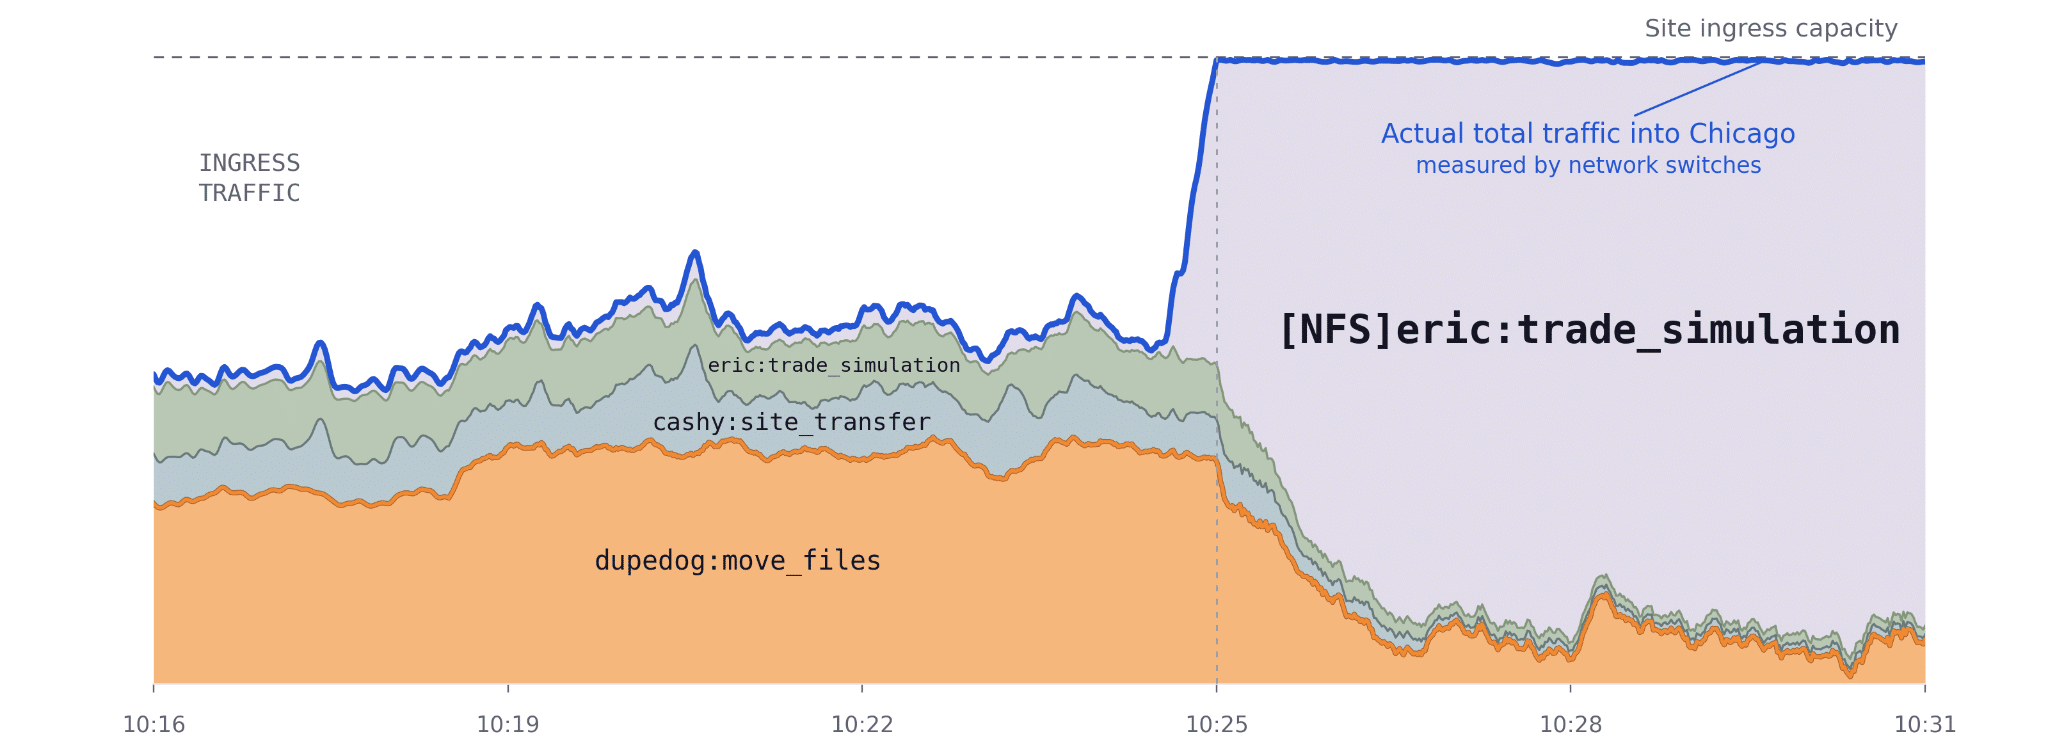
Finally, we know what happened. It was, of course, a configuration error. Thousands of jobs in Chicago wanted to read a large data file stored in New York. We usually handle this situation by loading the file into Chicago’s instance of Cashy, our distributed file cache. The file moves a single time over the WAN and is then efficiently served to the compute jobs.
A reasonable plan, if followed. Instead, we accidentally pointed everything directly at the source filer in New York, which happily sent the file across the country thousands of times. Worse still, the readers all wanted the same file, so the NY filer’s local cache helpfully prevented disk I/O from slowing any of this down.
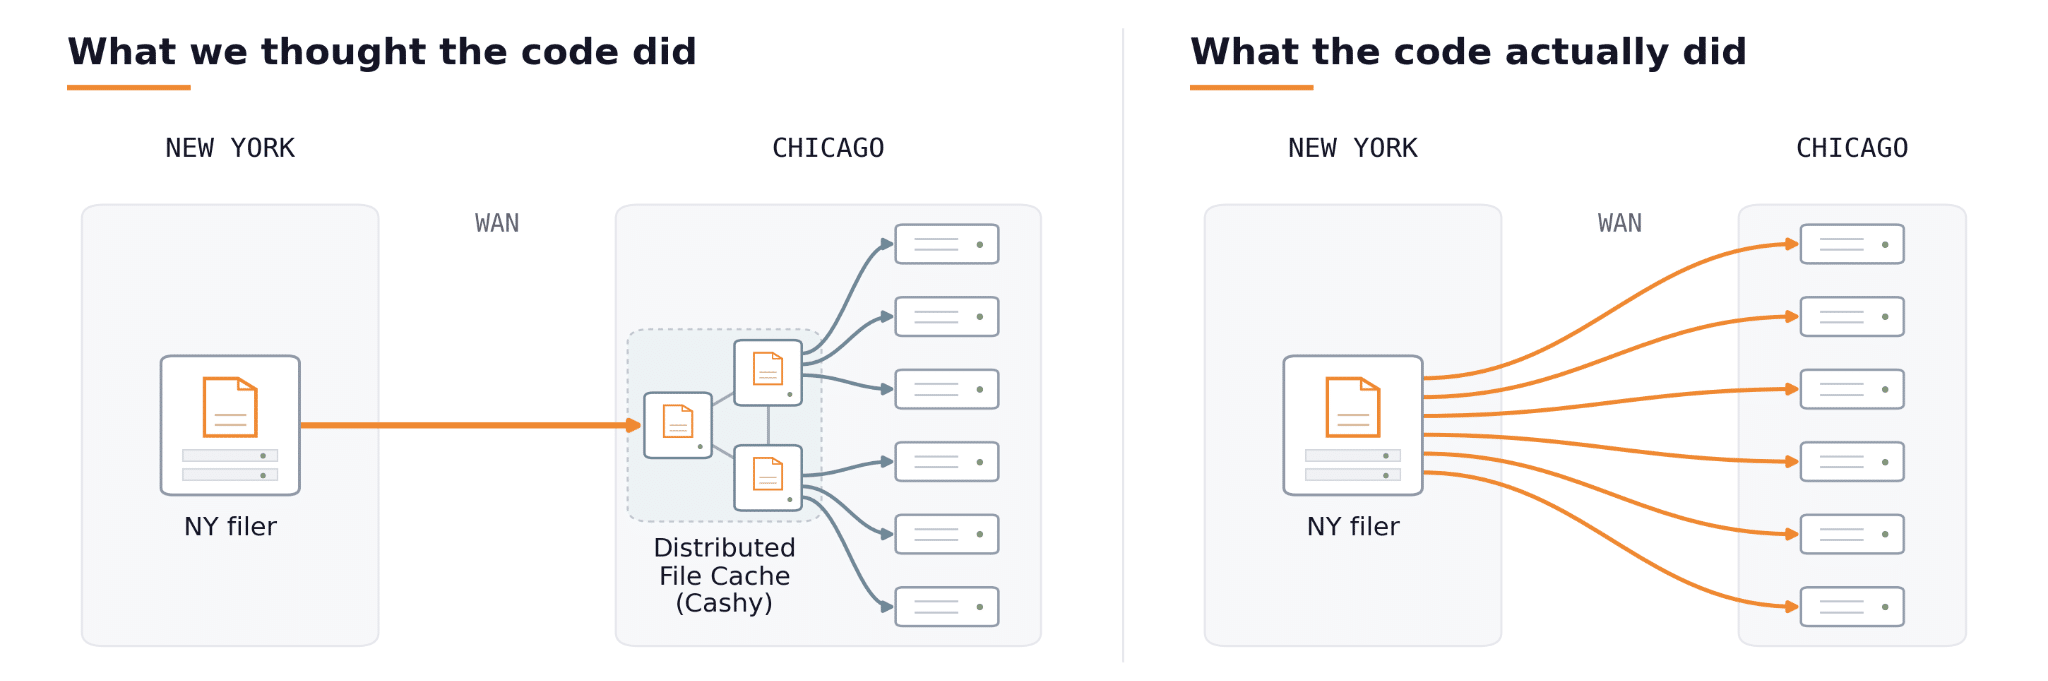
In retrospect, this was a simple mistake with an easy fix. Our tracing helped with the hard part: figuring out what the mistake even was.
We Still Need Those Service Logs
Much of our WAN traffic came from eric:trade_simulation, both directly via TCP sockets and indirectly via (unintentional) NFS reads. But what about dupedog:move_files? If we want a full account of all the network traffic from eric:trade_simulation, we need to include any files this workflow asked DupeDog to transfer on its behalf.
Fortunately, we already solved this problem near the start of this article when we looked at DupeDog telemetry. eBPF socket hooks can’t see who originally requested the file transfer, but DupeDog can. The best view of this data will be a synthesis of multiple sources:
- eBPF for socket traffic via
tcp_recvmsg/tcp_sendmsg. - eBPF for NFS-related network usage.
- Service logs for DupeDog, Cashy, and any other relevant services.
- Network switch byte counters, an independent, authoritative total to compare against our user-attributed traffic.
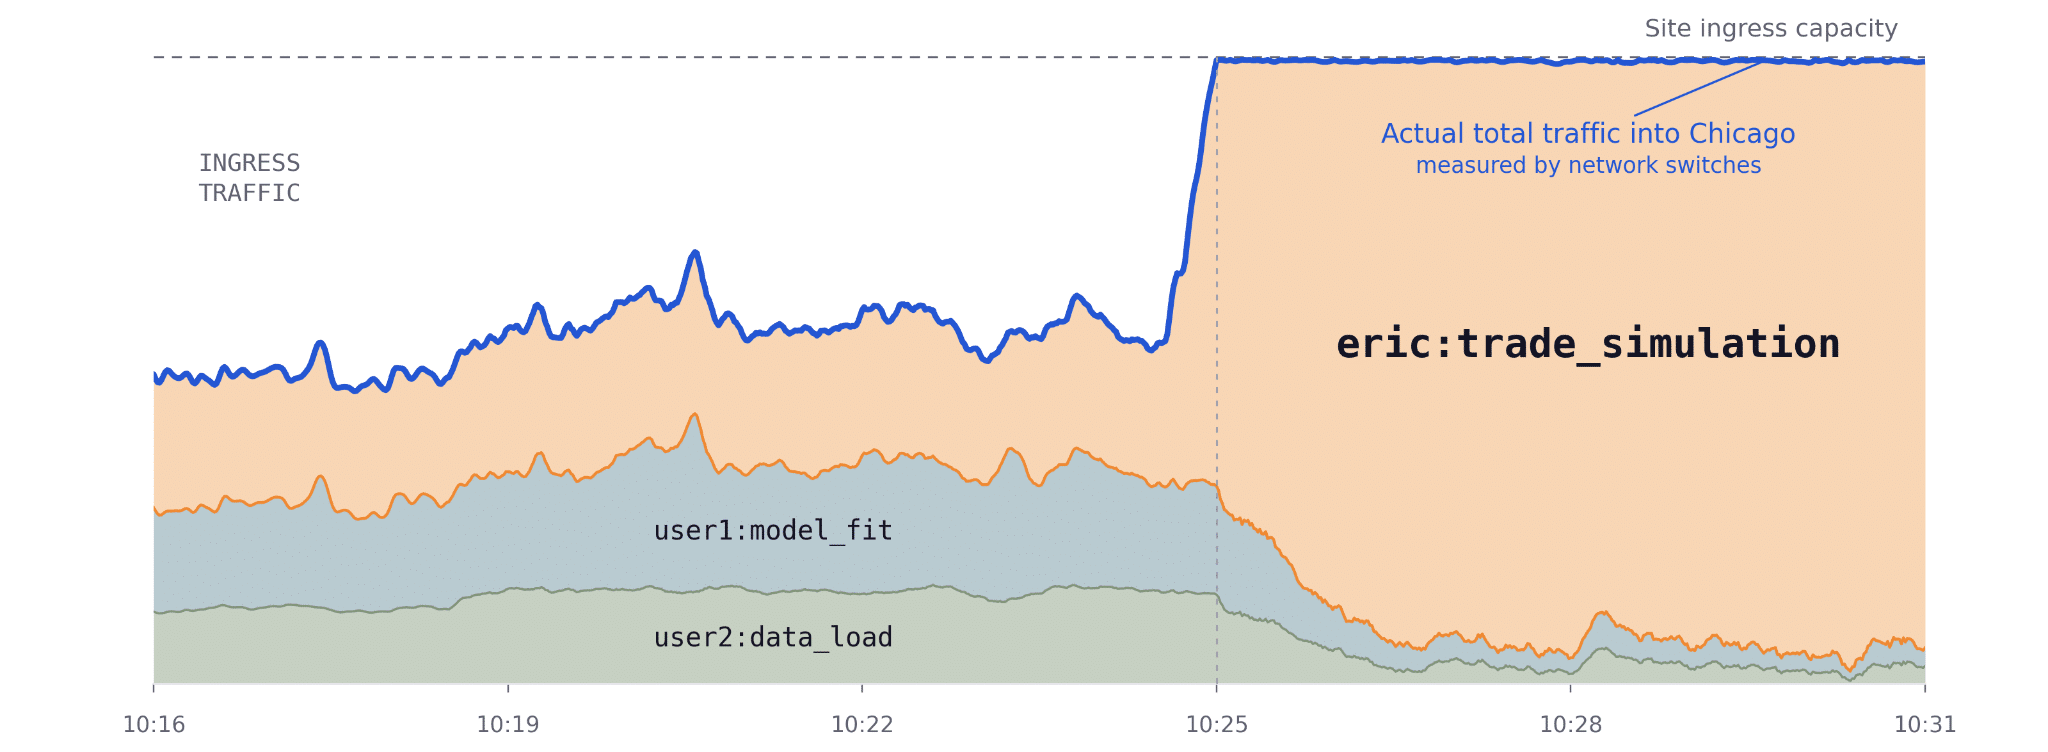
In this plot, we don’t care that eric:trade_simulation is moving data in three different ways (DupeDog, NFS, and custom TCP socket code). We’re only concerned with the total number of bytes moved. This is the view we wanted at the start: a comprehensive attribution of network activity to the users and workflows responsible!
Every Byte Counts, but Only Once
What happens when we ask a service like DupeDog to move some data from NY to Chicago?
- eBPF sees a
tcp_sendmsgon host NY123, remote host CH234.user=dupedog. - eBPF sees a
tcp_recvmsgon host CH234, remote host NY123.user=dupedog. - DupeDog logs record a NY123→CH234 transfer on behalf of
eric:trade_simulation.
Our ultimate goal is to decompose the total usage by user and workflow, but we cannot naively add up these records because we’d end up with a measurement that triple-counts and exceeds the true network usage.
Instead, for each type of flow, we ensure that we count it only once. In the above example, we’d exclude eBPF data for the dupedog user/port, knowing that it would be better represented by the DupeDog logs. We similarly exclude port-2049 (NFS) traffic from our eBPF TCP dataset because we separately capture it with our NFS hooks.
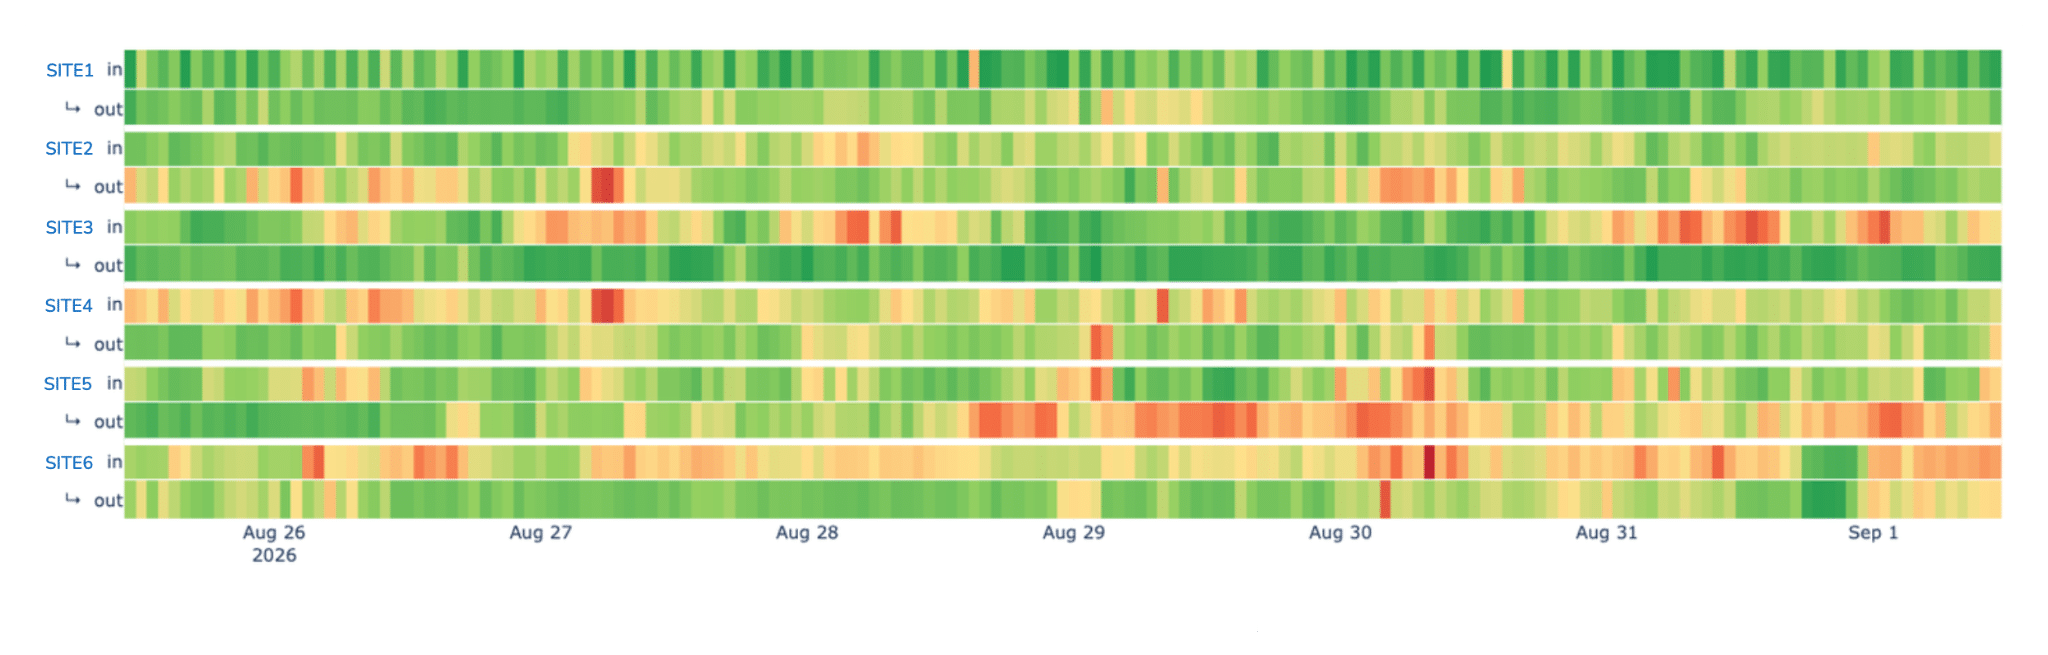
We use heatmaps like this one to track how well the user-attributed totals match our switch counters. This image shows a few selected sites. Green indicates good agreement, and red shows us when we’re missing something. We recently noticed that we weren’t including filer-to-filer replication traffic, because neither end of the connection was running our eBPF recorder. Fortunately, we have separate metrics describing this replication traffic.
Mostly Accounted For
We use this data all the time now. If our networks suddenly overload, we can see which workflows generated the traffic. When we move a program to a new location, we can see what data and services it talks to and decide whether to move them too. We also have automated processes to throttle workflows that cause various types of havoc. This telemetry lets us include “saturating the WAN” on the list.
That heatmap still has some red blocks to explain. If you want to help us figure them out, or if you have a better idea altogether, we’d love for you to apply.